See the big picture with My Dashboard

Editor’s note: We’ve made some updates since this post was published. Now you can use Portfolios to monitor and manage multiple projects in one place.
One of the most challenging parts of managing an organization is getting a high-level overview of what’s happening across multiple teams quickly and accurately. This information is critical to steering a department or a company, but it’s usually out of reach of a manager and can only be summoned through a lot of “work about work”: weekly status emails, meetings, and scattered summaries. Asana helps your team achieve its goals, hit its deadlines, and communicate more, but when you wanted to see the big picture, or show your project’s status to an executive, there was no easy place to begin.
So we imagined how we could make the status process simple and automatic. How we could make the huge effort of sharing and understanding the progress of multiple projects and teams just go away. The result is our new Dashboards feature, which replaces the chaos of status emails, meetings, and check-ins with clarity and transparency for anyone in your organization. You no longer have to hunt down the answer to the most important question you have, “How are we doing?”, because it’s now available in one place, one click away.
A new level of visibility
There are two parts to Dashboards: My Dashboard, a new view accessible from the left pane, and Project Overviews, which can be found in the right pane of every project.
My Dashboard: Clarity on what you care about most
In the left pane, underneath My Tasks and Inbox is My Dashboards. This view gives you a whole screen report on the projects you’re watching. Like most things in Asana, what you see in your Dashboards is your choice. You can add, remove, and select the order of projects, so you only see the things you care most about. Each card shows you the project name, project owner, and a real-time quantitative and qualitative status for the project. We’ve made the status format super simple to understand – with a colored bar at the top, a qualitative status area below, and an interactive progress chart at the bottom. At a single glance, you can tell what projects are on track, and which ones need your attention. Once you’ve customized your dashboard view, you can even share it with other teammates or executives in your organization by sharing the link with them. You can have up to 3 projects on your Dashboard in a free Asana Organization, and as many as you want if your company has a premium Asana Organization.
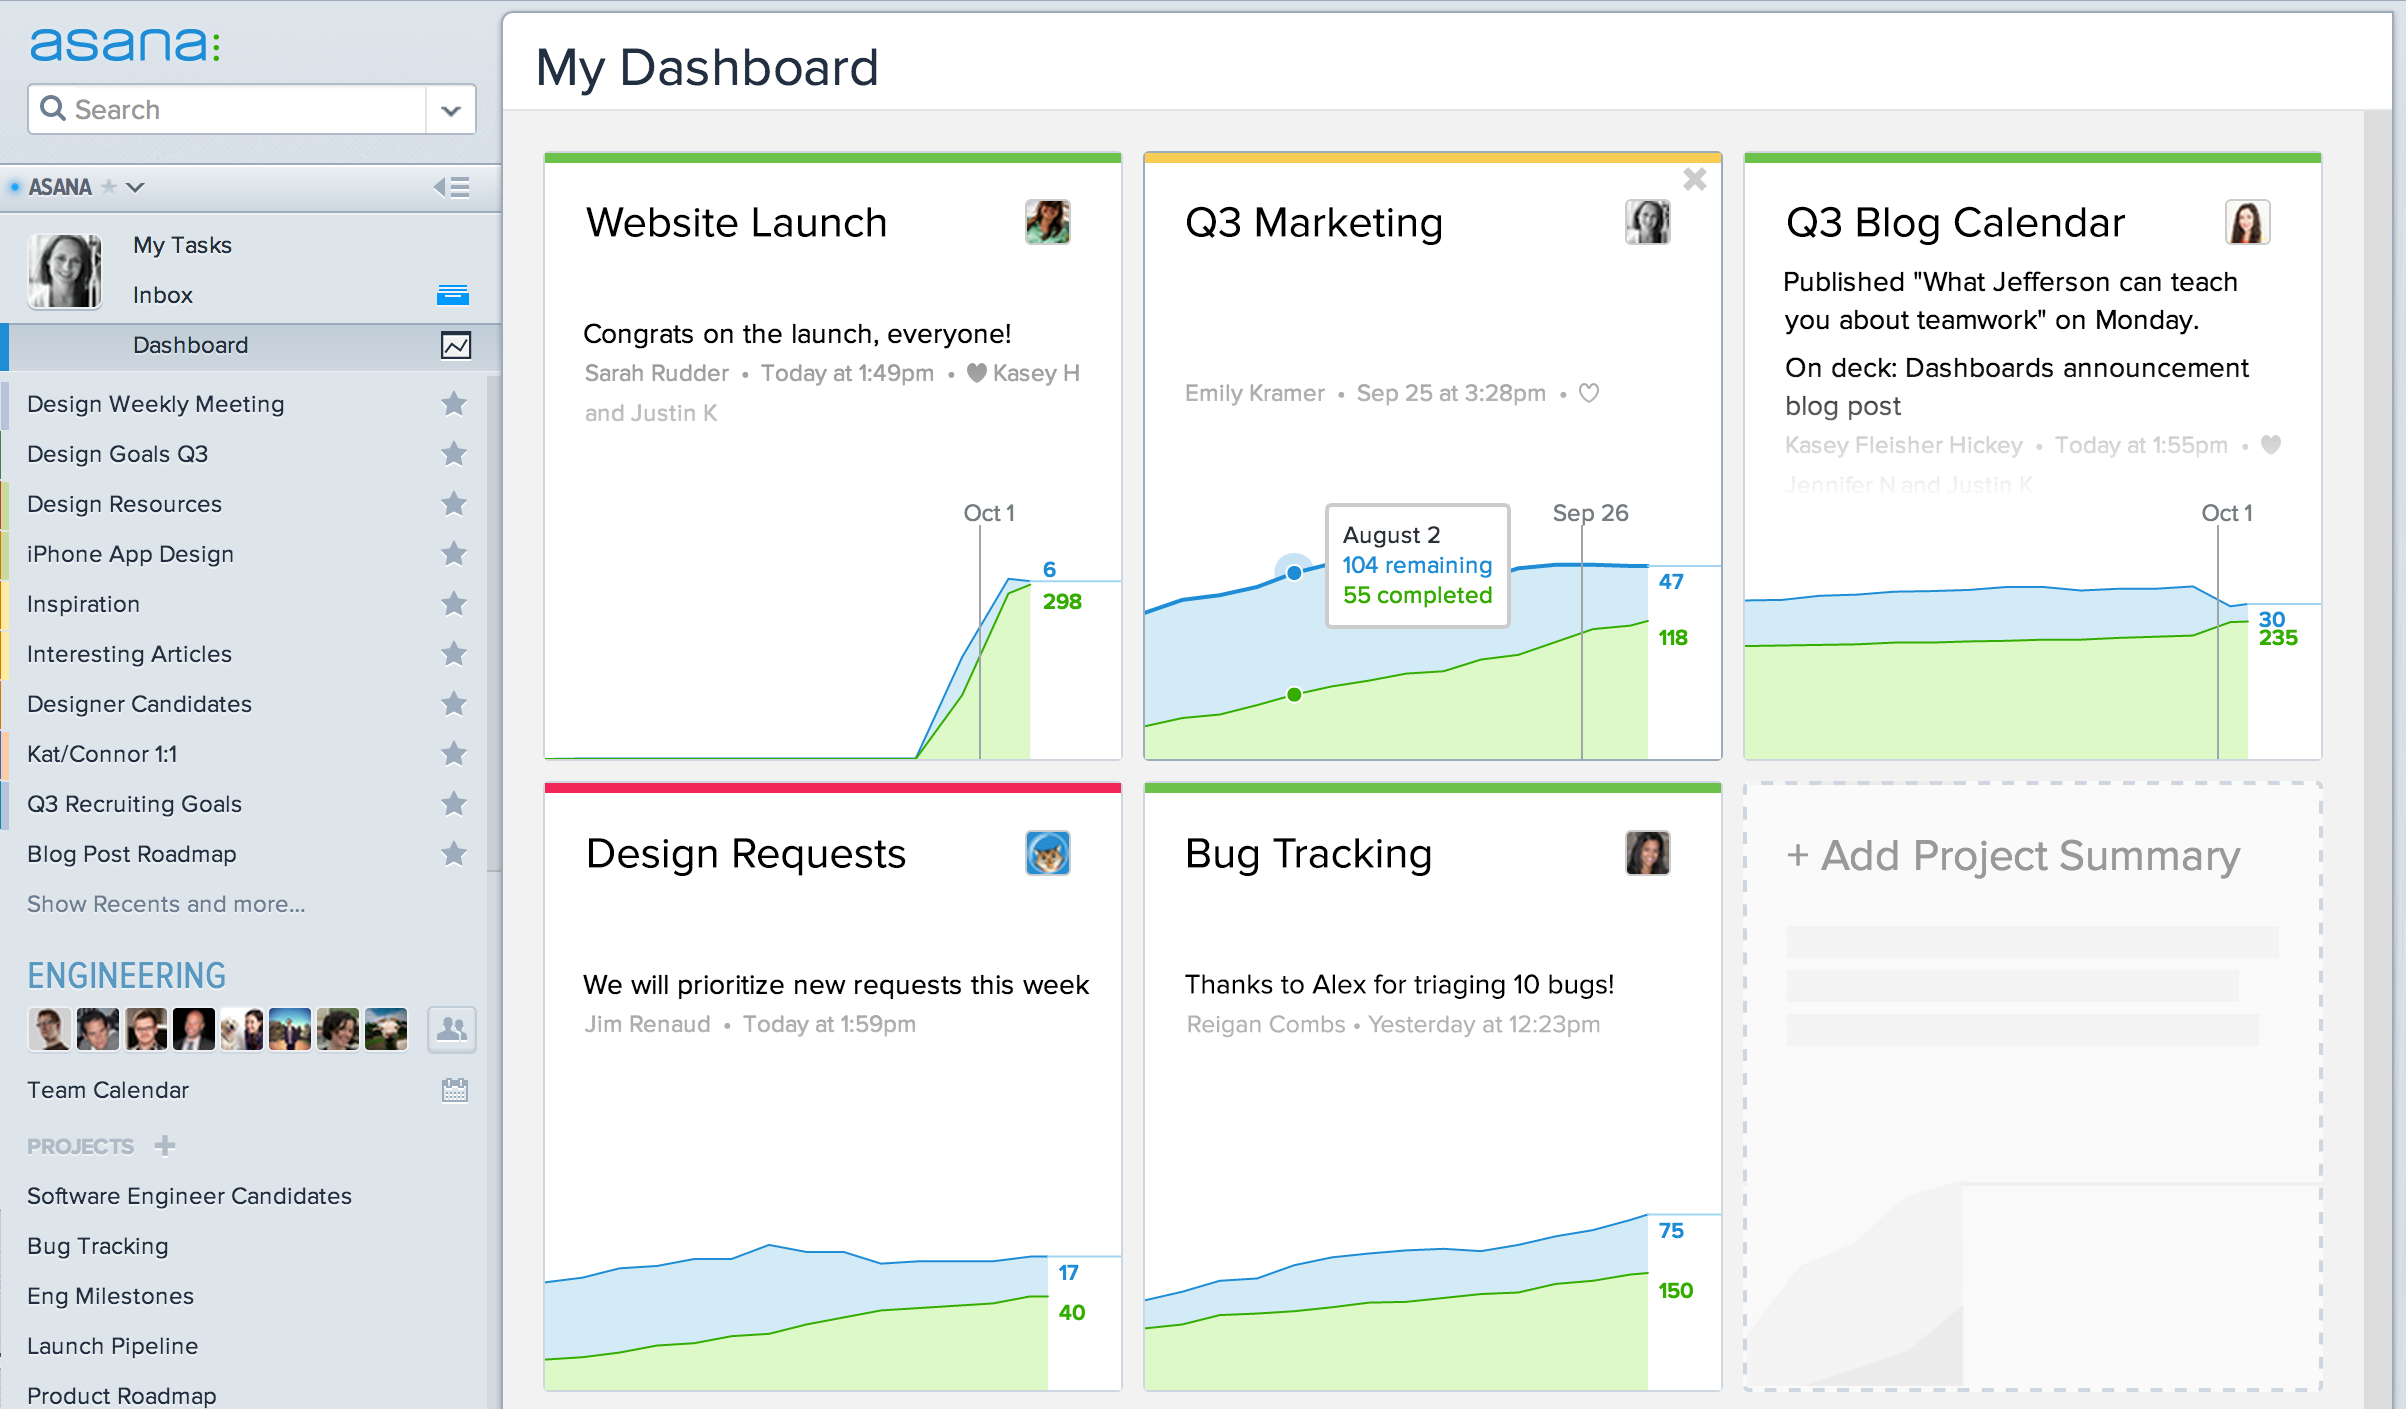
Dashboards offer team leads and executives just enough information to answer the important question. Here’s an example of a Dashboard that was created by a marketing team lead who needs to know where the product and design teams stand. The projects at the top row of this Dashboard were added to see which projects hit their due dates at the end of this quarter. For more information, the marketing lead can click into any project card to access a more Project Overview. In the above example, Design Requests and Bug Tracking do not have project due dates, but our marketing lead can see the number of tasks added over time in blue, and completed in green on the progress chart. She’ll immediately see that Design Requests hit a stride about a month ago, showing a spike in completed tasks, but that this project seems to be slowing.
Project Overviews: Communicate your team’s progress
The right pane of every project is now the Project Overview. Here, you can choose a project owner, set a description of the project, set a project due date, and set the current status of the project. This view automatically informs the team, and anyone else you want, how a project is progressing and if the team will hit its deadline. And we automatically give a weekly reminder task to the project owner to update the status. Changes in Project Overviews automatically update the Dashboards for anyone following the project, so these manual status updates give project owners a powerful way to communicate the scope and progress of projects to teammates and executives.
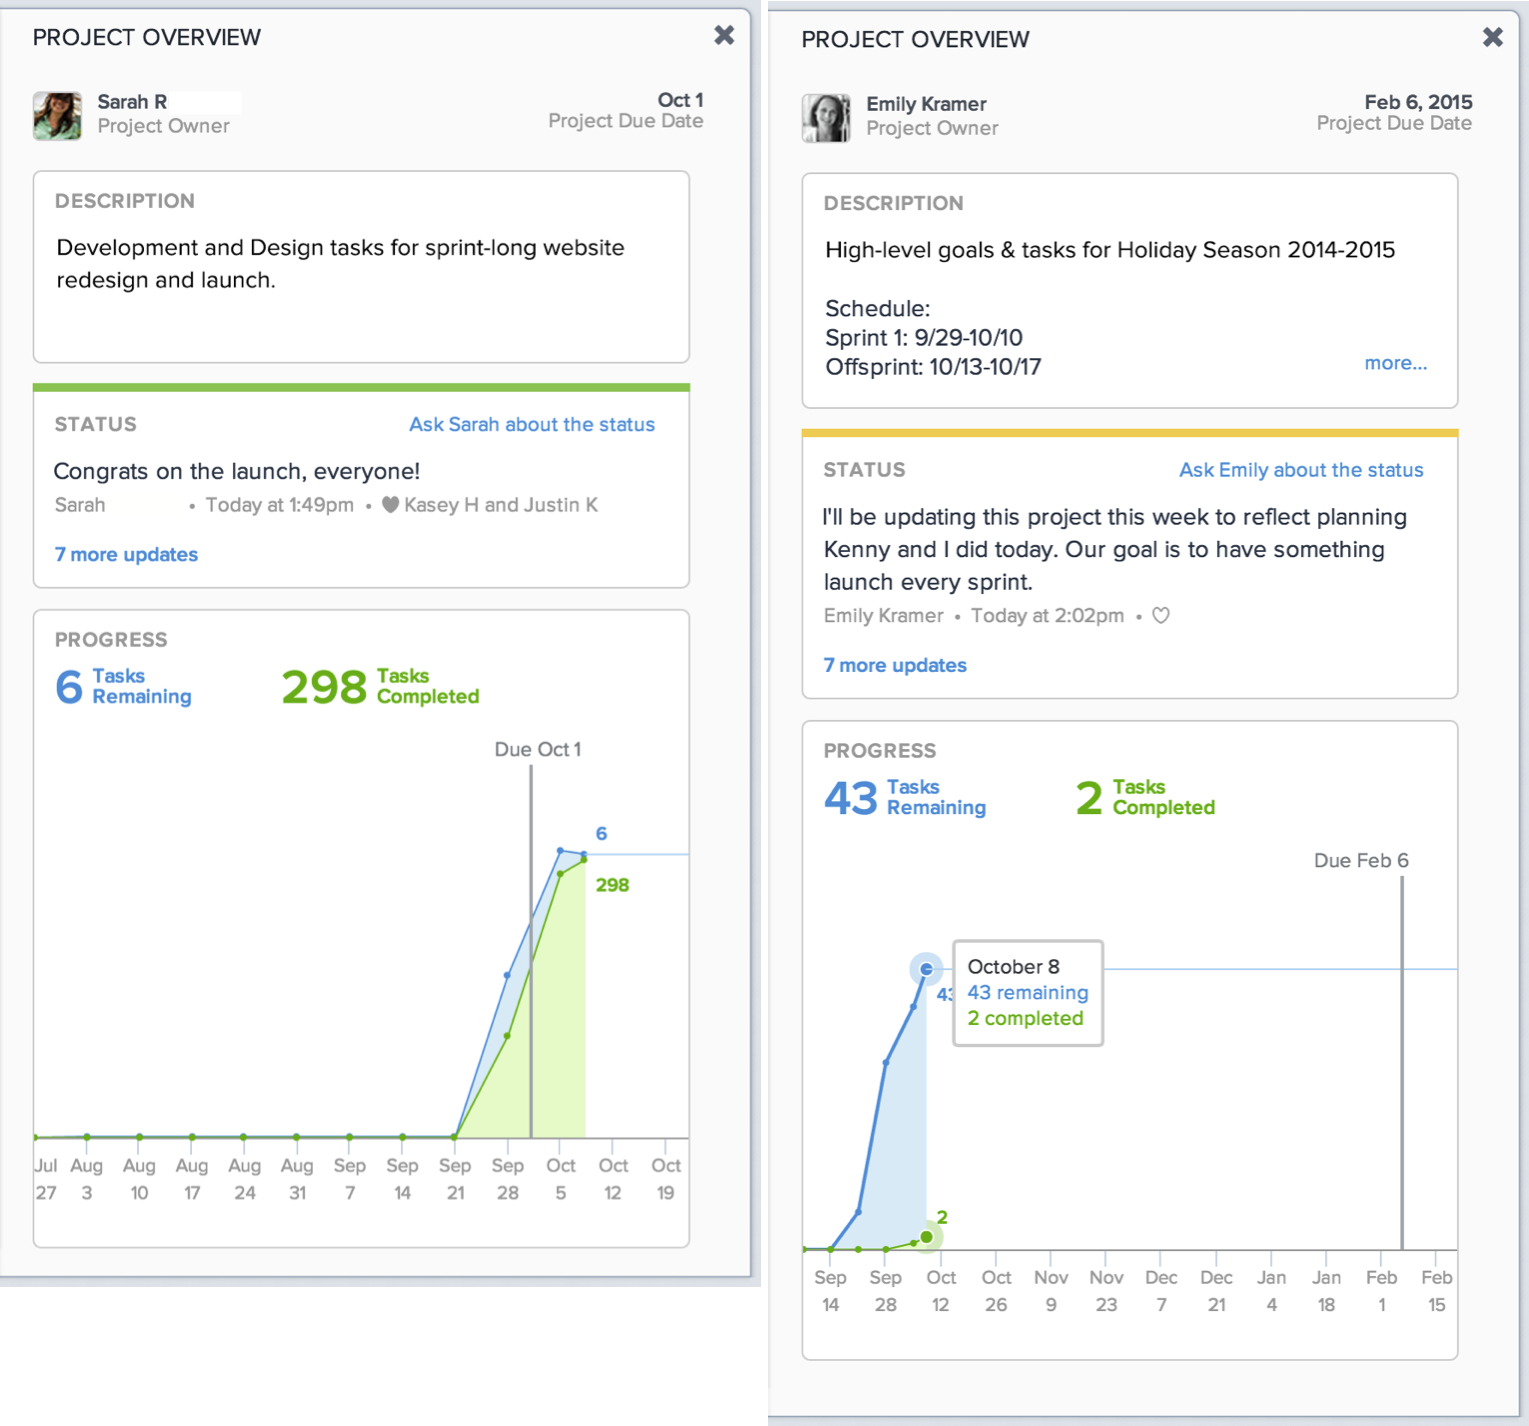
These two Project Overviews tell two very different stories at a glance. Sarah, the Project Owner, has just wrapped up a website launch. The project had a lot of momentum, and tasks got done very quickly after being added–the green and blue lines of the automatically-generated progress chart move together. While the team missed the project due date by a week, Sarah is excited to celebrate the launch with her team and that the project ended with a success. You can Heart this status update to show your appreciation for the launch. Emily’s project is just beginning. The team is in the ideation and planning stage, adding many tasks (blue line), but not yet completing many (green line). Since they haven’t gotten much done yet, Emily has selected the yellow status bar. You might realize you need to jump in and offer help during this planning stage.
Let Asana do the work
Asana is built around tasks, not just messages or emails. This means that features like Calendars, search views, and now Dashboards make use of the underlying structure of your work – what we call the Work Graph – to give you new and powerful ways to visualize and understand how your team is doing. Dashboards are just another step in harnessing the power of your team’s Work Graph, and we have many more steps in mind. Until then, give Dashboards a try and let Asana can do the work about work for you.
For more details on how to use Dashboards or Project Overviews, visit the Guide.