What data science told us about teamwork
Gaining a deep understanding how teams work together empowers us to help teams achieve greatness, across functions and fields. Being leaders in teamwork, though, starts with being a great team ourselves. With the help of Clark Bernier, a PhD student in sociology, we recently decided to take a look at how we’re growing, collaborating, onboarding new team members, and more.
If you’re interested in the technical details of how we conducted this study, check out Clark’s in-depth post on our Engineering blog. In this post, we’ll give you a snapshot of what teamwork look likes at Asana.
As a PhD student and sociologist, I am fascinated by how people work together. Using the vast amount of data Asana has collected around the way we (Asanas) work, I wanted to see if we could deepen our understanding of these everyday interactions.
Understanding the data
The data used for this study consists of approximately 500,000 “notifications” which include interactions by Asana employees and guests, inside Asana. When Asanas create and share tasks, comment, and heart them, they are automatically contributing to this living, breathing, network of work.
We used a number of tools and systems to come up with these visualizations. This new approach to data analysis isn’t unique (VoloMetrix, an analytics startup recently shared how they use a similar system applied to sales and marketing communication), but it’s a fairly progressive method for evaluating project and task collaboration between individuals at work.
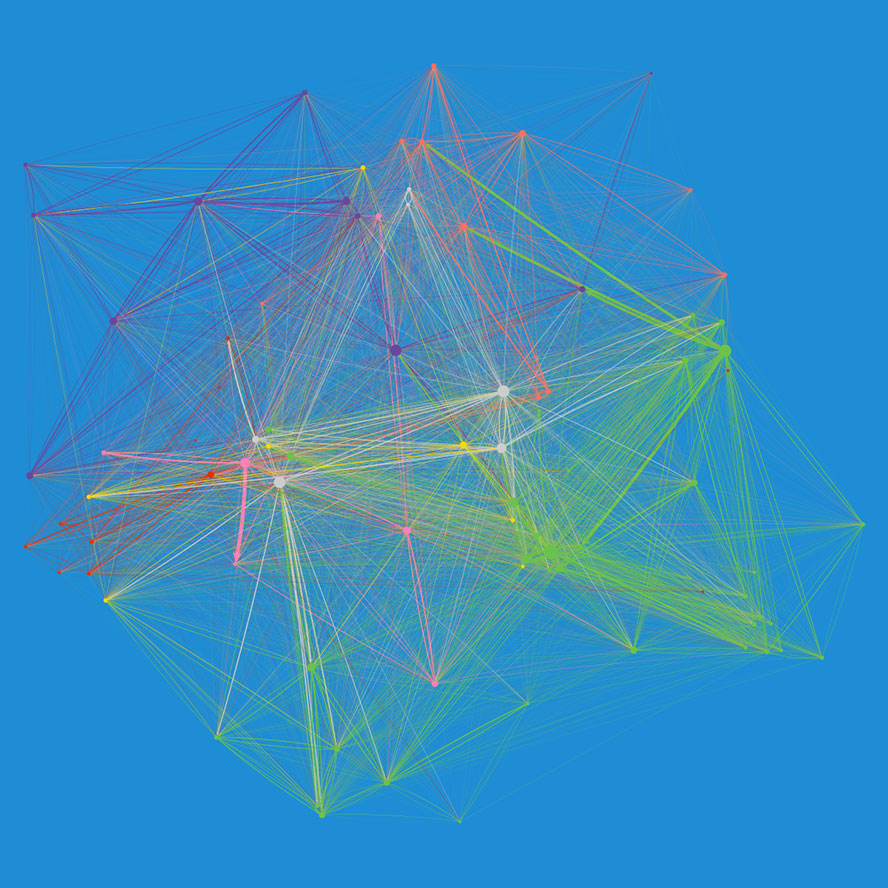
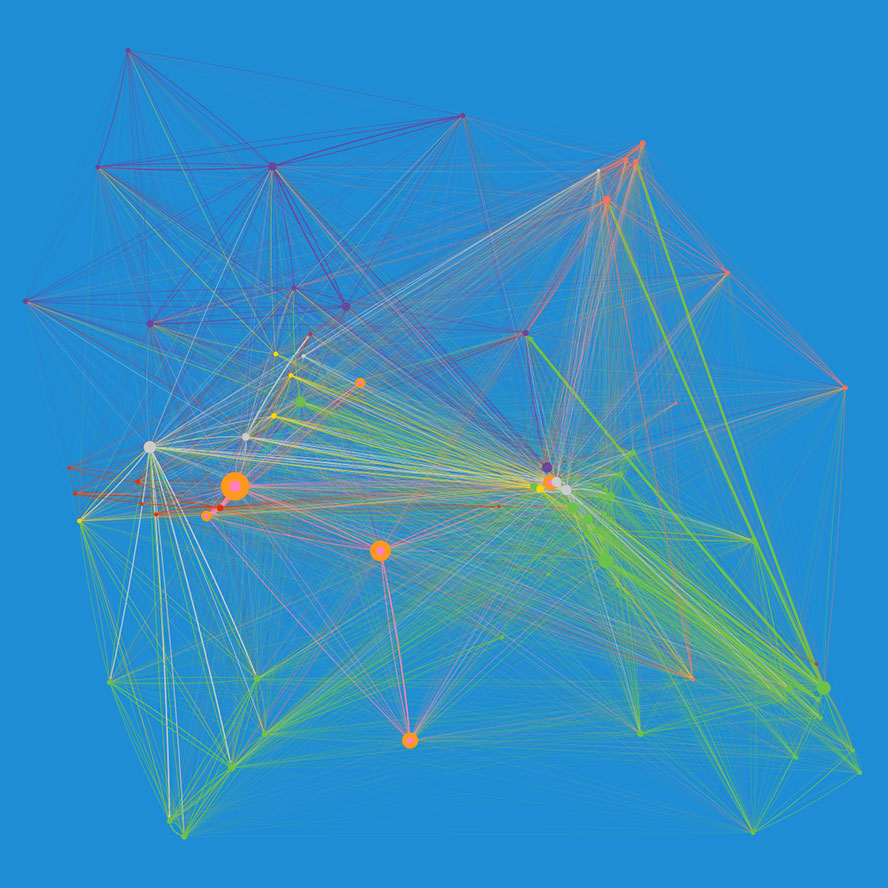
Do you notice that some dots (or nodes) are bolder and bigger than others? They represent individuals who are ‘loud’ at Asana — those who create the most notifications in Asana. These are individuals who contribute to many tasks, and often hold “broadcaster’ roles in the company (ie: product leads and managers).
Despite growth, we’re highly collaborative
You might expect that as our company grows, cross-functional collaboration decreases dramatically. But, one of the most satisfying discoveries we made was that despite our growth (we’ve nearly doubled in size since we began analyzing this data), the average Asana works with 70-80% of other Asanas in any given month. So when we say we’re a company focused on teamwork, we really, truly live and breathe this statement. While major initiatives, such as our mobile launch and web redesign led to more collaboration within individual teams, our company as a whole still remained tightly interconnected.
Our work, as you can see from the visualizations, ebbs and flows and our interactions are often representative of major initiatives and team milestones. At times, the recruiting team is more deeply ingrained in another team (during the hiring process for a candidate, for example); at other times, the marketing team feels a little more self-contained (ie: when they are working on a marketing-specific initiative).
Our interactions also reflect our unique episode structure. During Roadmap Week, for example, a time when everyone in the company is actively planning future episode week and gathering committees to share ideas and plans, we see intense cross-functional collaboration. This is reflected not only in the data, but our office environment: there’s a buzz and energy as Asanas prepare for weeks of prioritized work.
Lastly, it’s worth noting that we’re very invested in our internship program, and it’s exciting to see this reflected in our work. Asana interns are rapidly brought into the core of engineering work which means that our interns aren’t just on the periphery; they’re ingrained in the threadwork of Asana.
We’re dedicated to pioneering a new way to work, one that empowers teams and teammates, and keeps their work connected, as opposed to silo’d in emails and disparate apps. Just by putting our work in Asana, we’re creating an environment that supports and encourages teamwork, and it’s exciting to see these efforts reflected in the thousands of interactions we have with each other, all in Asana.
You can read about the study in more detail on Asana’s Engineering blog, where you’ll also find visualizations that illustrate each of the findings.
More Issues