What does a day of collaborating with Asana look like?
Collaboration may be universal, but we know that work practices differ across teams based on a variety of factors. Teams don’t work with an identical cadence across days of the week, and the cadence of teamwork over the course of a day tends to differ across geographies as well. With a mission to help teams everywhere work together effortlessly, we wanted to take a look at these differences, both to understand them better and to ensure that Asana is meeting the needs of millions of teams across the 190 countries in which it is being currently used.
In this article, Lili Yao, Neel Rakholia, and I from Asana’s Data Science team will present some interactive visualizations and discussion of how Asana usage represents a week of work across the globe.
Visualizing a Week of Collaboration in Asana
Since our focus was on teams working together, for the purpose of these visualizations, we filtered de-identified Asana usage data to count only collaborative actions as activity. We aggregated three months of this collaboration data to create a view of what a typical week in Asana looks like. Details around how we aggregated the data to arrive at the visualizations can be found in the Appendix.
The graph represents the proportion of each weekday’s collaborative events that typically occur during each minute of that day, adjusted to account for different time zones.
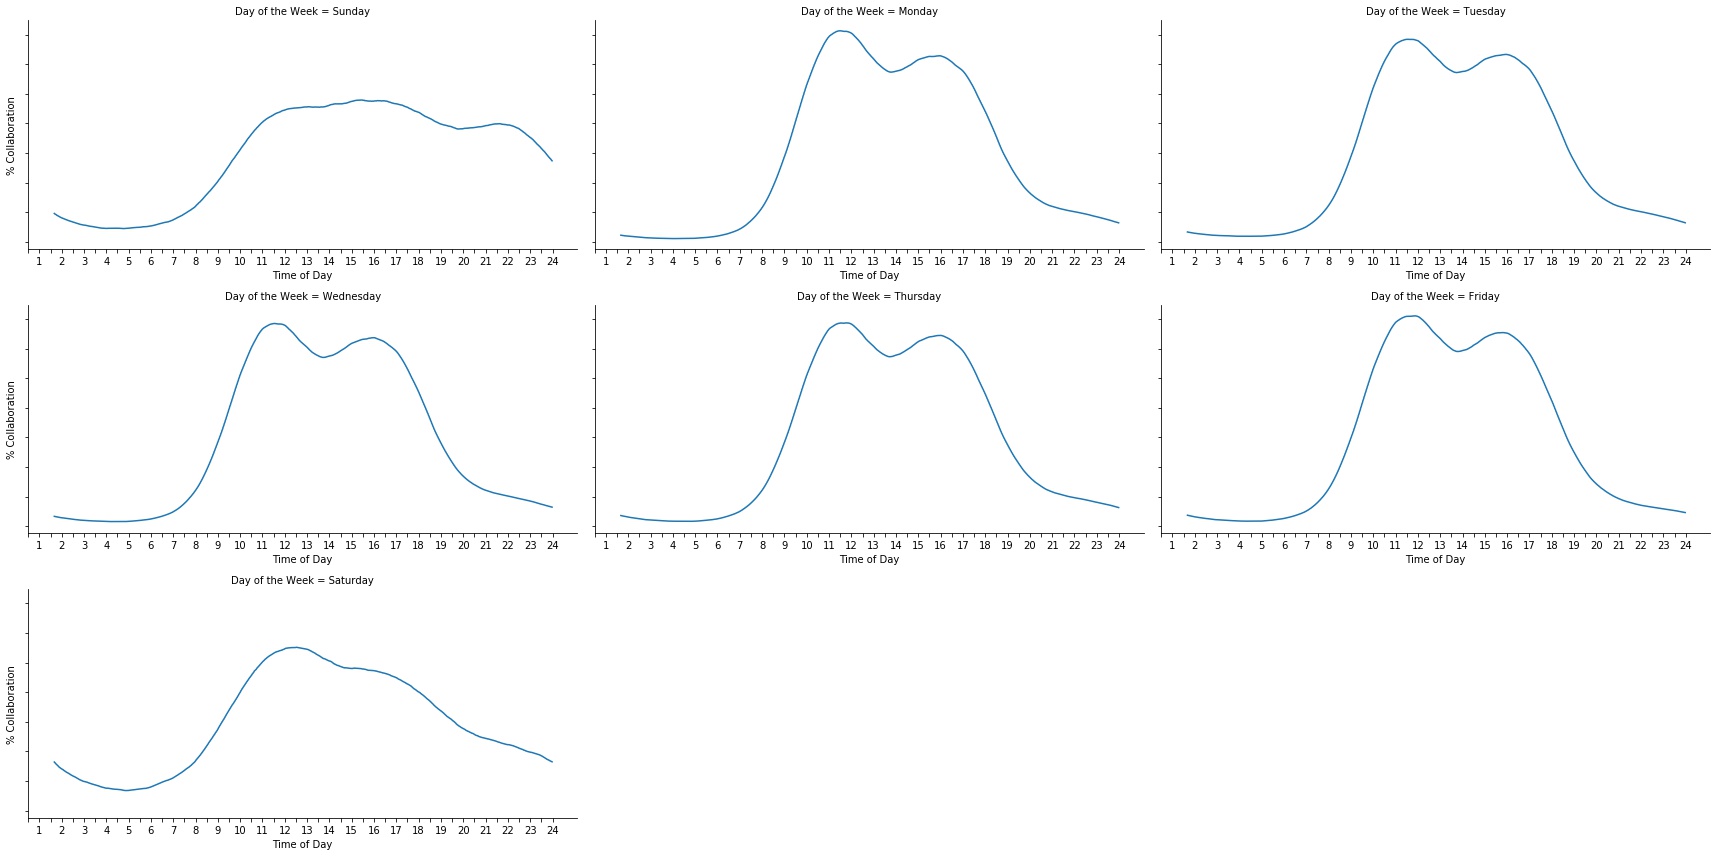
It’s clear that the rhythms of teamwork in Asana are visibly different on the weekend (Sunday and Saturday) as compared to the rest of the week (Monday through Friday). While Sunday is quite distinct from Saturday, we chose to focus more on Saturday since Sunday is a day off from work in most places. From here, we will zoom in on Monday and Saturday, first to compare the days of the week themselves and then to see how activity varies by country.
Visualizing Monday Collaboration in Asana
Similar to the graph above, this graph represents the average proportion of the day’s collaborative events that happened minute by minute over three months of Mondays, with the time of day adjusted to account for different time zones.
Looking at Monday’s collaboration patterns, we observed:
- A spike of activity close to noon
- A dip between 12:30 pm and 2 pm
- A gradual decline in collaboration from around 4:00 pm, accelerating after around 5 pm
Assuming that the mid-day dip represents lunch time and that the 4:00 pm drop-off represents the end of the work day, it appears that Asana usage captures the typical work-day cadence for a team.
Visualizing Monday Collaboration in Asana by Country
But how does this pattern of usage differ around the world? Next, we consider a similar visualization of Asana collaboration over three months of Mondays across 10 countries.
As we suspected, the globally aggregated pattern of collaboration on Mondays hides some notable cross-national differences that this graph reveals. For instance, while most countries seem to have a clear end to the work day, others such as the Philippines seem to maintain a higher level of collaboration activity well into the night. The duration, depth, and exact timing of of the lunchtime dip varies across countries as well — for example, Italy and India appear to take lunch later than other countries.
The graph above is interactive. What other differences do you see by country? You can share your observations in the comments.
Now that we’ve examined Monday by itself, let’s compare it with Saturday.
Comparing Monday and Saturday Collaboration in Asana
While Monday gives us a decent snapshot of what a day filled with teamwork looked like, Saturday is different. In many parts of the world, Saturday is a day off of work for most people, while in other places, it’s commonly a half day.
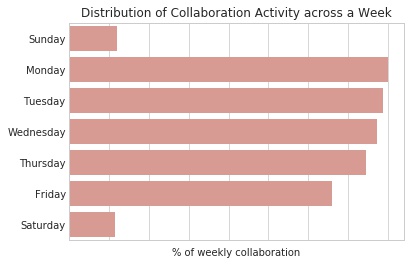
The first evidence for this can be observed from the visualization below. This graph displays the proportion of a week’s collaboration for each day of the week. Clearly, Saturday has fewer collaborative events than Monday.
So is it the case that the within-day work trend for Saturday is similar to the trend for Monday, except that it involves fewer events? We plotted the within-day trend for Saturday and Monday to find out.
The within-day work trend for Saturday isn’t quite similar to the trend for Monday. On Saturdays, Asana collaboration seems to start tapering off between 1:00 and 2:00 pm and doesn’t have distinct before-lunch and after-lunch peaks like Mondays do. We know that in some countries, Saturdays are half days for work, and it seems that more collaboration happens on Saturday mornings. However, we also see a greater proportion of Saturday work happening in the early morning and in the evening compared to Monday. This may suggest that people who are working on Saturdays are also less tied to traditional work hours in general, which could be a result of individual preferences or the demands of certain jobs. This could indicate a propensity to work with your team only during the first half of the day and then gradually taper off work post-lunch.
Of course, the aggregate isn’t the truth for everyone. For many people, Saturday isn’t a work day, and for them we would expect little or no collaborative activity as reflected in the collaboration activity by weekday graph at the beginning of this section. On the other hand, people in certain types of jobs may be expected to work on Saturdays, and if they or their companies are working on weekends, they might also be likely to work outside of traditional office hours, perhaps leading to the higher relative levels of late-night and early-morning collaboration we see on Saturday vs. Monday. And in some countries, Saturday is a half or full work day for office workers, too.
Next, let’s look at the Saturday data by country to see if it sheds more light on these collaboration patterns.
Visualizing a Saturday of Collaboration in Asana across the Globe
Similar to Monday, we observe some nuances in the distribution of teamwork on a Saturday across countries. For instance, Israel tends to be more active much later in the day than other countries, and while some countries show a gradual declining collaboration trend throughout the day, for other countries Saturday has two distinct peaks, making it seem similar in trend to a typical work day, like Monday.
Next Steps and Conclusion
We set out to explore how the rhythms of collaboration work in Asana vary among teams across the globe. In this analysis, across both days of typically high and low teamwork activity, we observe significant variances across teams based on their country. While this is interesting anecdotally, it is an important component of building empathy for all of our customers. As Asana is US-based and works Monday through Friday, we might make design assumptions about weekends not being work days, say in the design of Calendar view. But that assumption would not hold globally or for all jobs or industries. A simple use-case for this analysis is recognizing off-peak hours for our customers. These are the hours when we may perform maintenance tasks. From this analysis we note that generically assuming that the hours after 11 pm local time on Saturday are off-peak for all countries might actually hinder some of our customers.
However, this is just one possible slice of our data and to truly ensure that everyone’s working styles are supported by Asana, we need to continue exploring the dimensions along which teams differ beyond geography, such as industry, function, and company size. Nuances of teamwork discovered from such analyses can help us continue to build an empathetic and comprehensive understanding of all teams. This in-turn can help Asana enable teams to work together effortlessly in order to help humanity thrive.
Appendix
Collaborative Asana Activity
For this analysis, we counted only collaborative actions involving another member of one’s team as activity. View-only actions were not counted as activity.
This meant, for example, that if a user visited their My Tasks view in Asana on a given day, we did not count this as Asana activity. One the other hand, if the same user created a task and assigned it to their teammate, we consider this to be a collaborative action and counted this as Asana activity.
Methods
We queried our log data to retrieve all collaboration events that had occurred between January and March of 2019. The timestamp for each event was adjusted for the local timezone of the user and for daylight savings where applicable. The timestamp was also rounded to the nearest minute.
To get a snapshot of what an average Monday of Asana collaboration looks like, we took an average of collaborative events by the day of the week and the timestamp. To reduce the level of noise in our aggregated data set, we also smoothed the data using a rolling window to ensure a clearer view of the enduring trend. Using the Highcharts library, we plotted the aggregated and smoothed data and thus the graph was created.
To get the amount of Asana collaboration across a week, we summed the average of collaborative events by timestamp. We similarly summed the average of collaborative events by timestamp to get the amount of Asana collaboration on each day of the week. We used this data to graph the distribution of collaboration across a week.
Assumptions
- Asana usage equals teamwork. One could argue that not all teamwork makes it into Asana. For this analysis, we assume that the rhythms of teamwork are mirrored by the rhythms of Asana usage. Even for teams where this assumption holds true, we assume that our metric of collaboration is a holistic proxy for teamwork. It could be said that if someone were a passive follower of a task, whose updates they were merely following out of interest, they shouldn’t be considered a collaborator on that task. Our current definition of collaboration, doesn’t discriminate on the passivity of a collaborator. For this analysis, still leverage this definition of collaboration.
- Aggregates are representative of the whole. We are making an assumption that averaging Asana’s collaborative events is giving us a view of Asana usage across teams and countries.