Dashboard reporting in Google Sheets

Editor’s note: We’ve made some updates since this post was published. Dashboard has been discontinued, but you can still create Google Sheets reports based on project data in Portfolios.
For team leads or project managers who are tracking work across lots of projects, Asana Dashboards are a great way to see progress across your projects at a glance. But sometimes you might want to do a deeper comparison across projects. That’s why we’re excited to introduce Dashboard reporting in Google Sheets. This new integration lets you build custom reports—tables, charts, scatterplots, and more—in Google Sheets, all using your Asana project data. Get insights on the projects that need attention, the rate at which initiatives are progressing, or who on your team is pushing work forward fastest.
Dashboard reporting in Google Sheets uses the new Google Sheets API that gives developers programmatic access to the most powerful features of Sheets, and respects the real time collaborative editing that Google’s platform is built on.
This integration is another way in which Asana and Google Apps for Work can be used together to help your team collaborate effectively and get great results. Asana also integrates with Google Drive, Google Calendar, Gmail, Google Chrome Extension, and more.
Dashboard reporting in Google Sheets is especially useful if your team has several projects that follow similar workflows. It gives you the power to conduct deeper comparisons of progress and productivity across all the projects in your Dashboard.
Ways to use Dashboard reporting in Google Sheets
Dashboard reporting in Google Sheets gives you many ways to sort and visualize the projects you track in Asana. For example, you may want to see which projects need the most urgent attention.
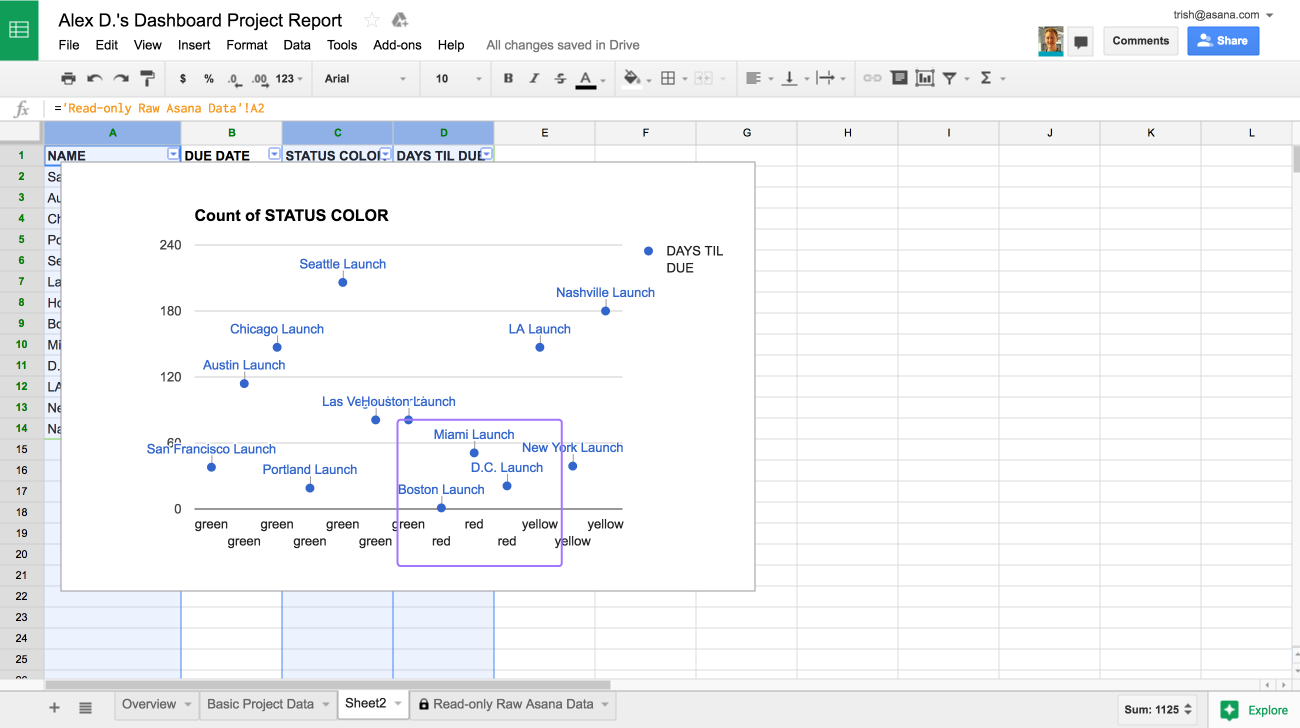
- Create a scatter chart of projects by due date and status color to identify the projects that are both at risk and due soon.
Or you might want to see which project owners have been moving work along quickly.
- Create a bar chart of recently completed tasks across projects owners to see whose projects are progressing fastest
Or maybe you’re interested in what portion of your projects are off track.
- Create a pie chart of project status colors so see how much of the overall work is on track, and how much is at risk.
And more! These are just some examples of the kinds of reports you can create in Google Sheets.
How to get started
Before opening a Google Sheet from your Asana Dashboard, you should make sure you have the right projects in your Dashboard. Only projects in your Dashboard will be added to the Google Sheet.
Asana Tips
Dashboard reporting in Google Sheets is especially powerful when you have several projects in your Dashboard. With Asana Premium, you can add as many projects to your Dashboard as you like.
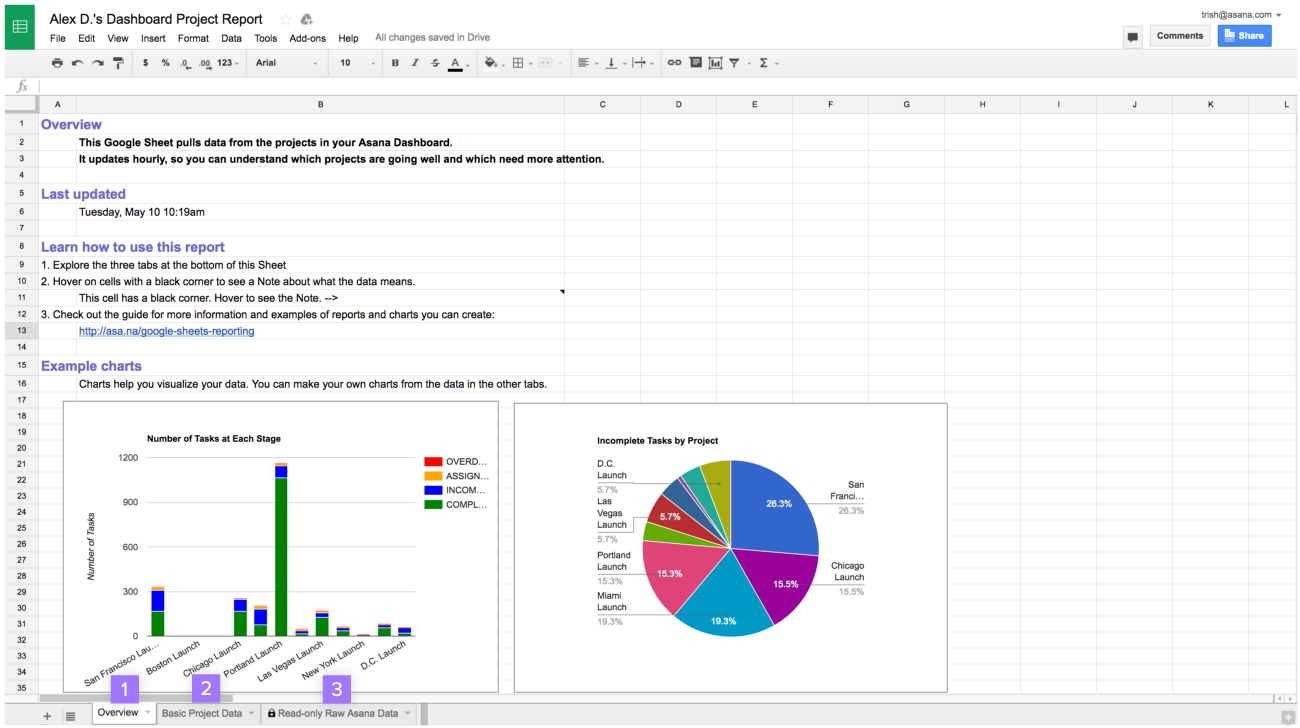
From the top right corner of your Dashboard click on Open Report in Google Sheets. When you open the Google Sheet there will be three tabs:

- Overview—serves as a reference on how to use the Sheet, and contains two example charts created from your data.
- Basic project data—shows the high-level data from each project. This is a selection of the most important columns available in the Sheet. You can explore this data by sorting or filtering by the columns.
- Read-only raw Asana data—pulls live data directly from Asana. This tab is locked to protect the connection to Asana.
Once you’ve familiarized yourself with the three tabs, you can create new tabs in the sheet for your own custom reports. Copy columns over from the raw Asana data tab to manipulate and visualize the data as needed using functions, pivot tables, and charts.
We have instructions for creating a scatter chart of projects by due date and status color (to identify projects that are both at risk and due soon), as well as a bar chart of recently completed tasks across projects owners (to see whose projects are progressing fastest). These reports might look something like this:


Deeper insights from your Dashboard
Dashboard reporting in Google Sheets can help you better understand how your projects are progressing, and analyze that progress against specific project attributes. We’re excited to see what reports you build with this and what kind of insights it helps you gather. Try it out and, please, let us know what you think!

